Know what worked, what changed, and why
Turn post results, audience growth, and channel trends into clear social media analytics reports without digging through native dashboards or spreadsheets.
Analytics for:
Trusted by teams at


Social media analytics that turn results into next steps.
Social media analytics should help you move from raw numbers to a clear story: what grew, what dropped, which posts earned attention, and what the team should learn from it. Pallyy keeps the useful metrics and report building in one place, so weekly reviews and client updates take minutes instead of spreadsheet work.
Measure
See which posts and channels are moving.
Bring the important performance signals into one place so your team can understand what happened without opening every native app.
Post tracking
Review post reach, impressions, engagement, likes, comments, and more.
Historical data
Look back across past results to understand performance over time.
Follower growth
See how your audience is changing across supported social profiles.
Reach and impressions
Track visibility signals that show how far your content is travelling.
Video views
Monitor video performance where supported by each social network.
Profile clicks
Understand which profile actions and links are getting attention.
Understand
Turn numbers into clearer content decisions.
Compare what worked, find useful patterns, and use audience insight to shape the next round of social content.
Top posts
Sort post history to find content that earned the strongest response.
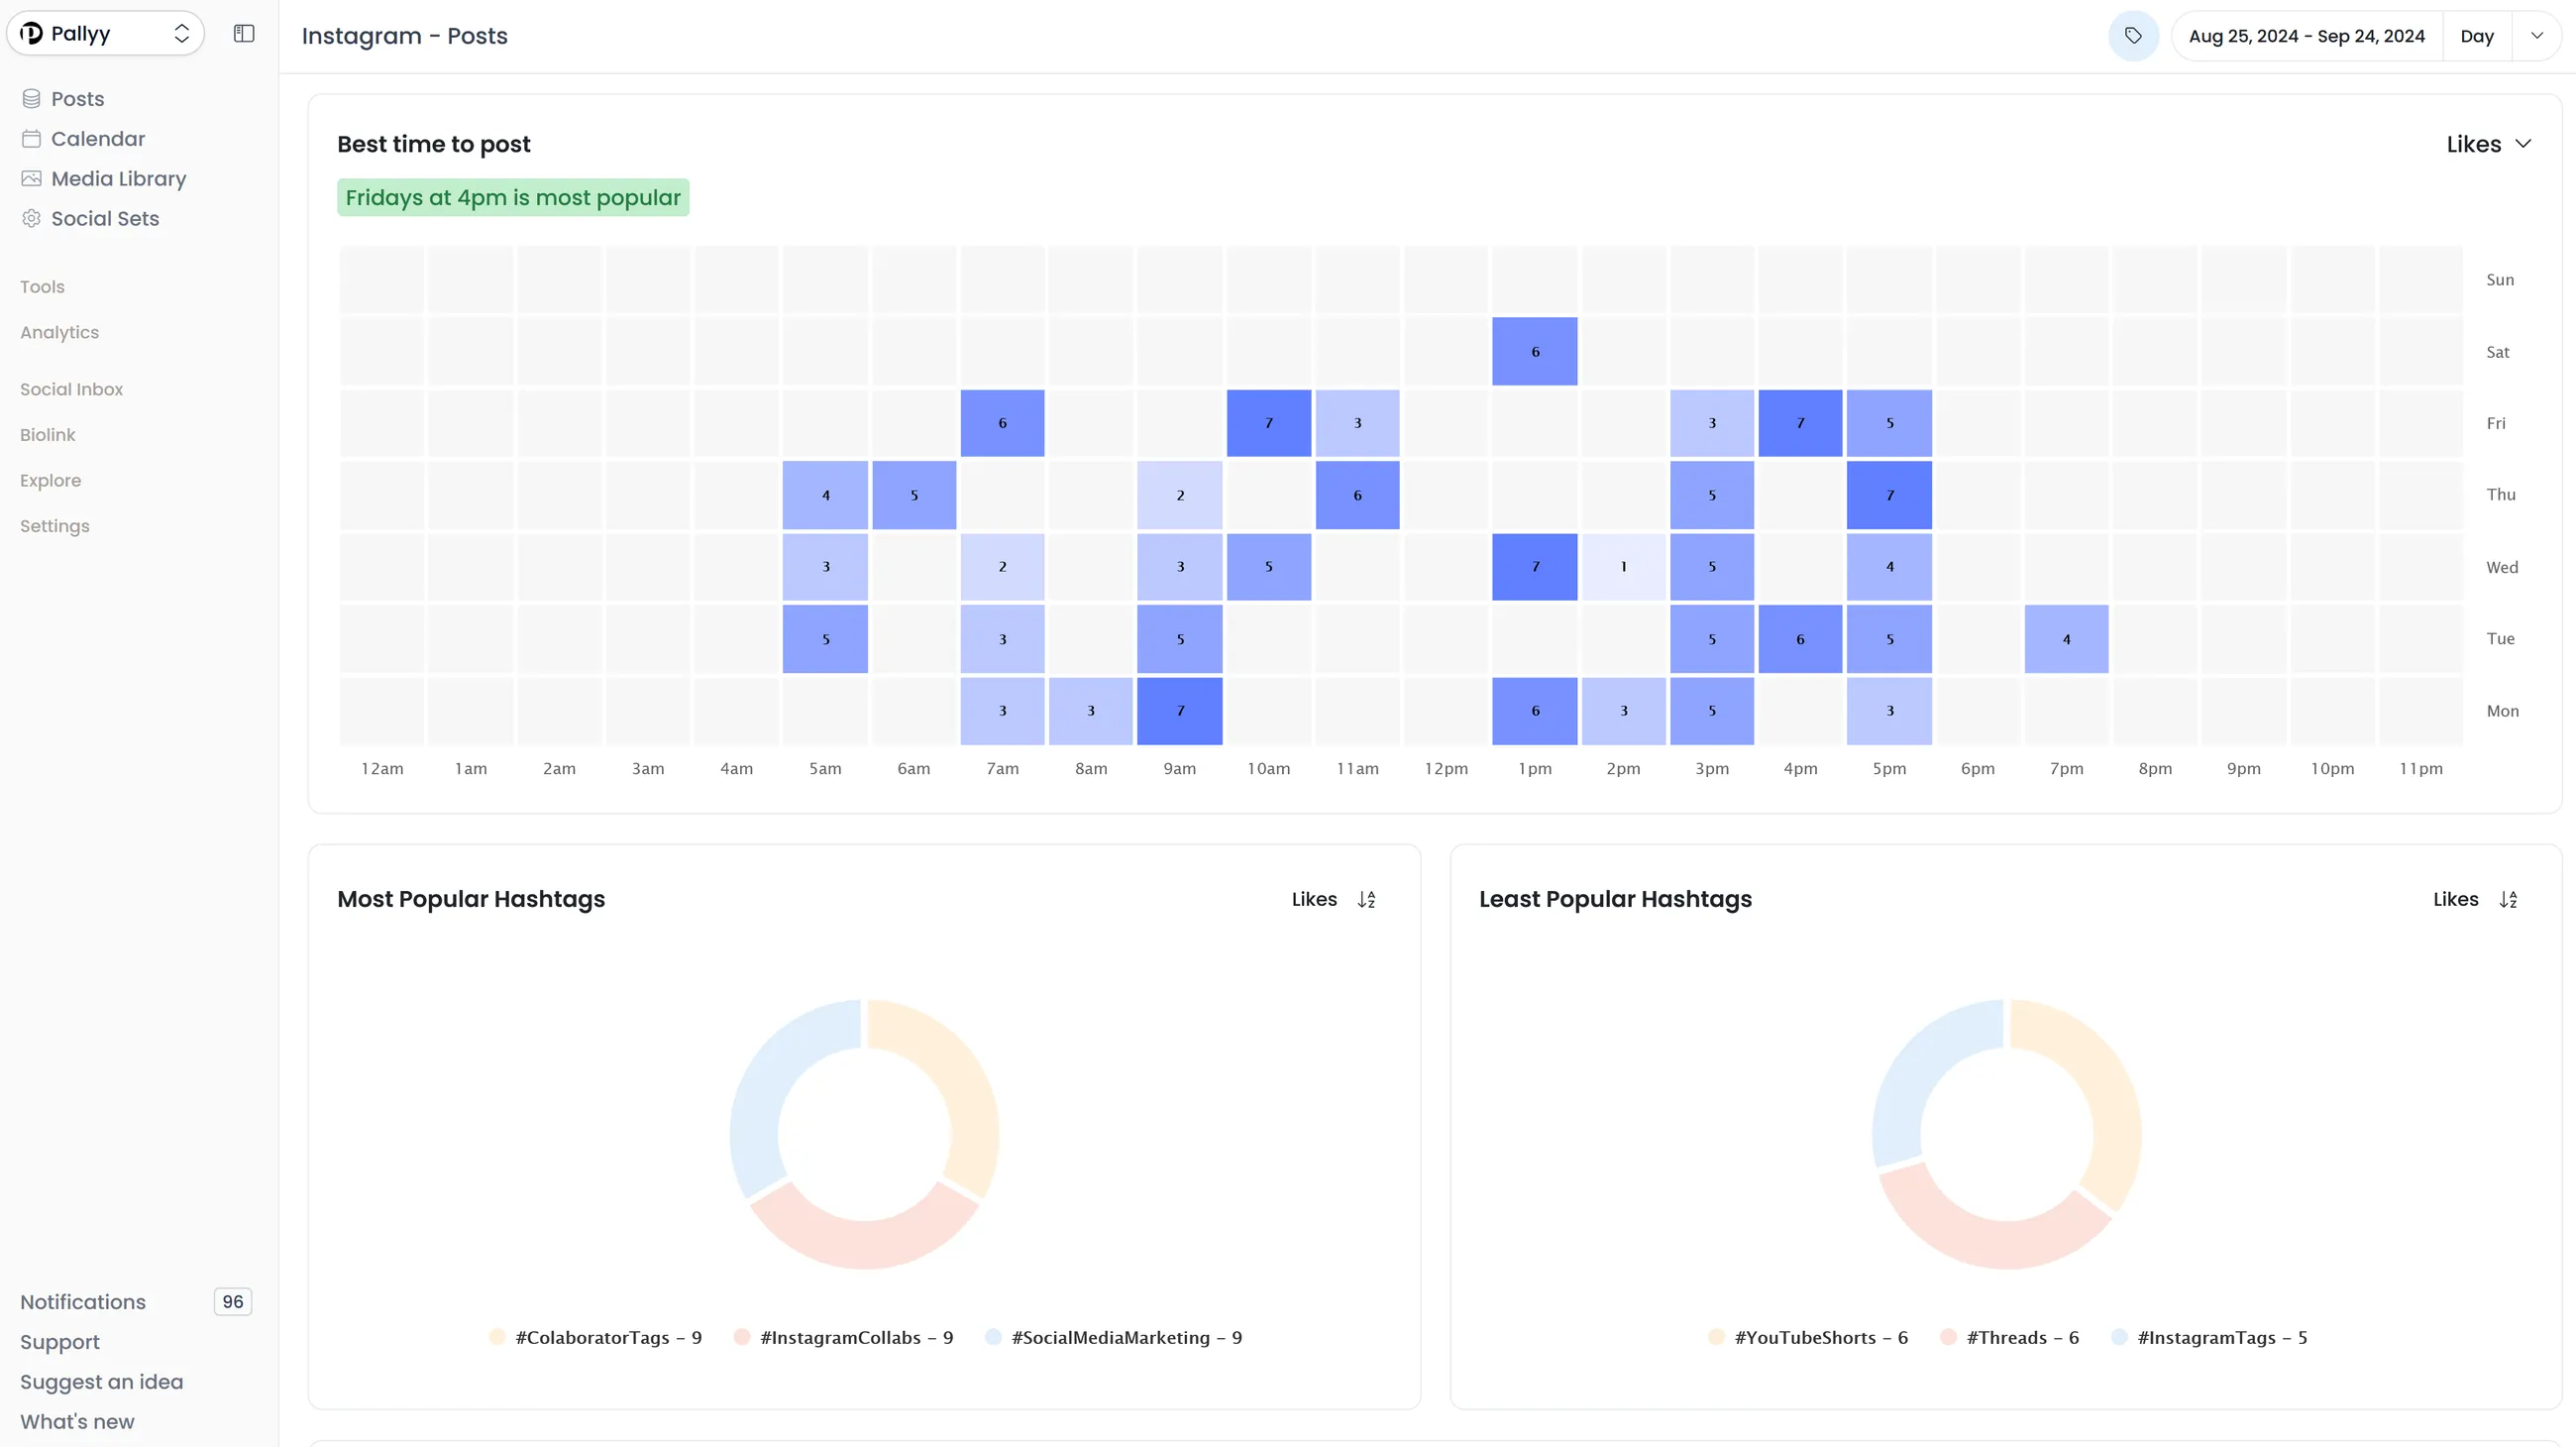
Best time to post
Use performance patterns to help decide when future content should go live.
Audience demographics
Review audience details like age, gender, location, and visitor demographics.
Hashtag insights
See how hashtags are contributing to Instagram post performance.
Competitor tracking
Track Instagram competitors to compare posting, followers, and engagement.
Channel comparison
Review Instagram, Facebook, and LinkedIn results without stitching reports together.
Report
Share results without rebuilding reports by hand.
Create clear reports for clients, managers, or stakeholders using the metrics that matter to each account or campaign.
Custom reports
Build reports with the widgets and charts your team actually needs.
Custom charts
Choose the views that make performance easiest to explain.
Choose timeframe
Set the reporting period for monthly updates, campaigns, or ad hoc reviews.
Unlimited reports
Create reports for different clients, brands, or internal workflows.
PDF export
Export reports as PDFs for clients and stakeholders.
Publishing context
Keep reporting connected to the social content workflow your team already uses.
Questions and answers
FAQs.
What should social media analytics help me understand?
Good social media analytics should show which posts performed best, how your accounts are growing, where engagement is changing, and how to turn those results into reports you can share.
Why is social media analytics hard to manage in native apps alone?
Because the data is spread out. Teams often jump between platforms, screenshots, and spreadsheets just to explain what changed. Keeping social media analytics in one place saves a lot of time.
Which platforms does Pallyy support for social media analytics?
Pallyy currently supports social media analytics for Instagram, Facebook, and LinkedIn, with custom reporting layered on top.
Can I turn social media analytics into reports with Pallyy?
Yes. Pallyy includes custom reporting so you can choose the widgets and charts you need, then export reports as a PDF for clients or your team.
Who is Pallyy social media analytics built for?
Pallyy is built for agencies, social media managers, freelancers, and lean marketing teams that want simple analytics and reporting connected to their publishing workflow.
What should I look for in social media analytics software?
Look for analytics software that covers the platforms you use, makes reporting easier, shows useful historical trends, and connects naturally with your publishing and reporting workflow.