Instagram is a huge marketing platform. With over 1 billion active users from all around the world, Instagram is one of the most used social media platforms by brands, influencers, advertisers and shoppers. But planning a good marketing strategy for Instagram is not easy. With so much competition you need to be well informed and know all about your audience demographics.
We've compiled a list of 49+ Instagram stats, demographics and fun facts to help you survive, strive and grow on Instagram in 2024.
Instagram usage statistics
The number of Instagram users continues to grow each year.
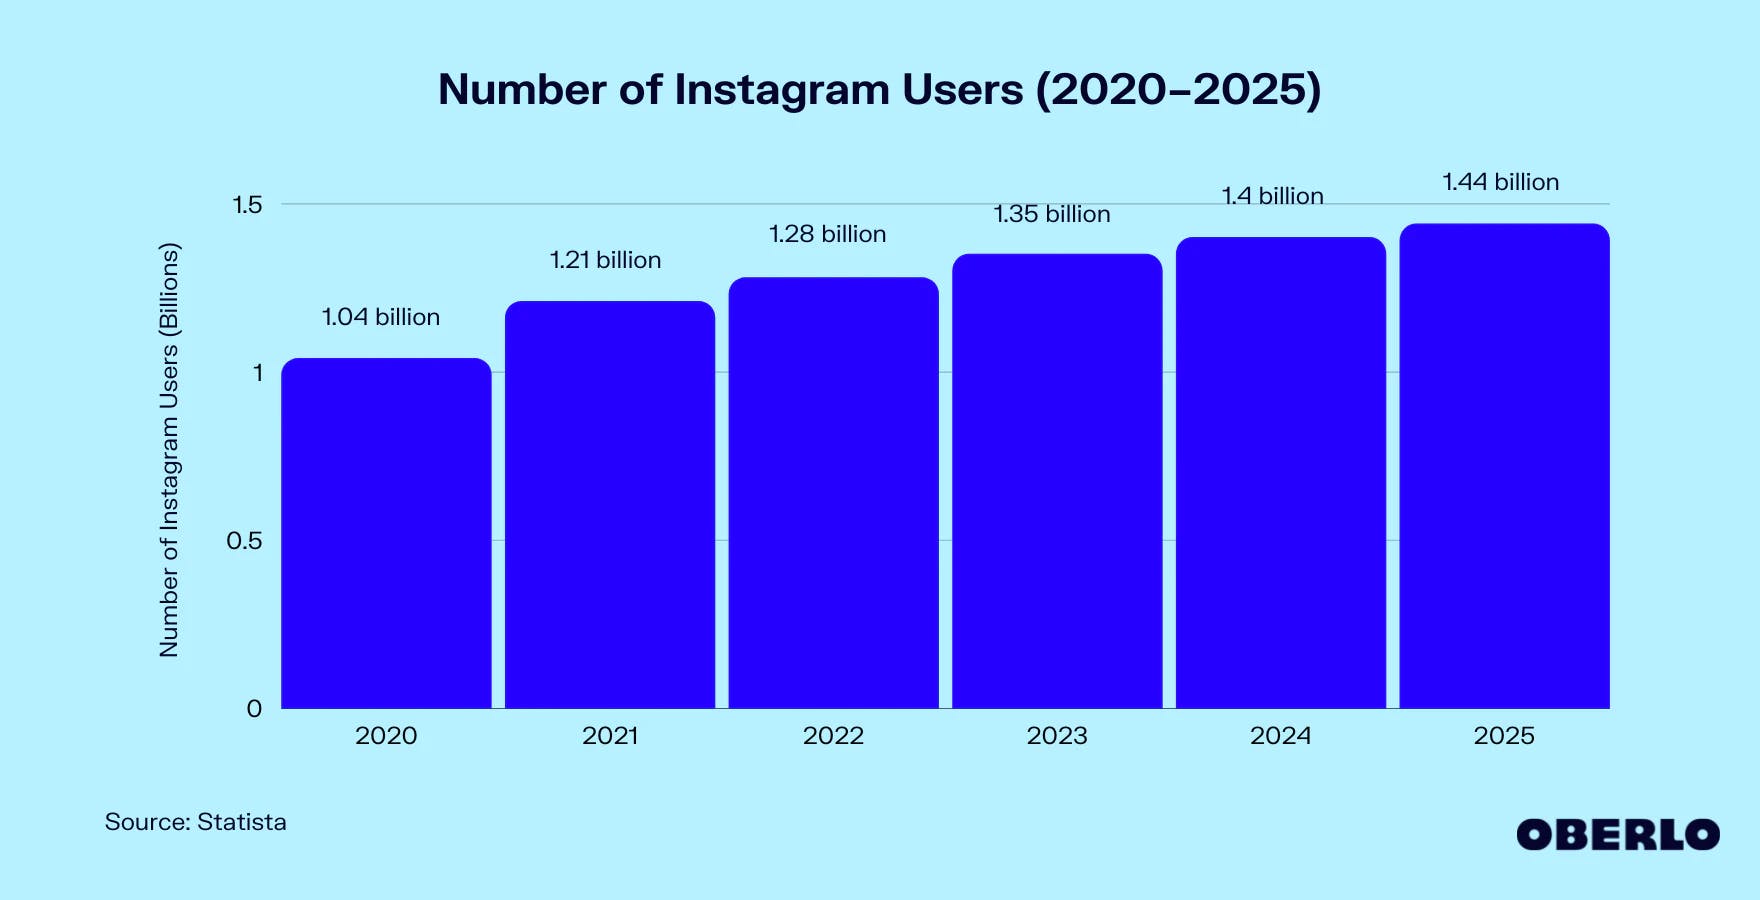
- The number of Instagram users is projected to reach 1.36 billion by 2024 and 1.44 billion by 2025.
- Instagram is the 3rd most downloaded app on Apple Store (3.8 billion app downloads) and the 4th across all mobile devices.
- In 2022, Instagram users spent on average 30 minutes per day on the platform (an increase from 28 minutes in 2020).
- 63% of Instagram users log into the app daily.
Instagram business statistics
Posting content on Instagram is getting more and more competitive.
- 25 million businesses are using Instagram in 2022.
- 2 million businesses are using paid Instagram ads.
- 60% of businesses use Instagram Stories every week.
- 83% of brands are confident that social media marketing brings them value and ROI (an increase from 63% in 2021).
- 36% of marketers plan to increase spending on social media in 2024.
Influencer marketing Statistics
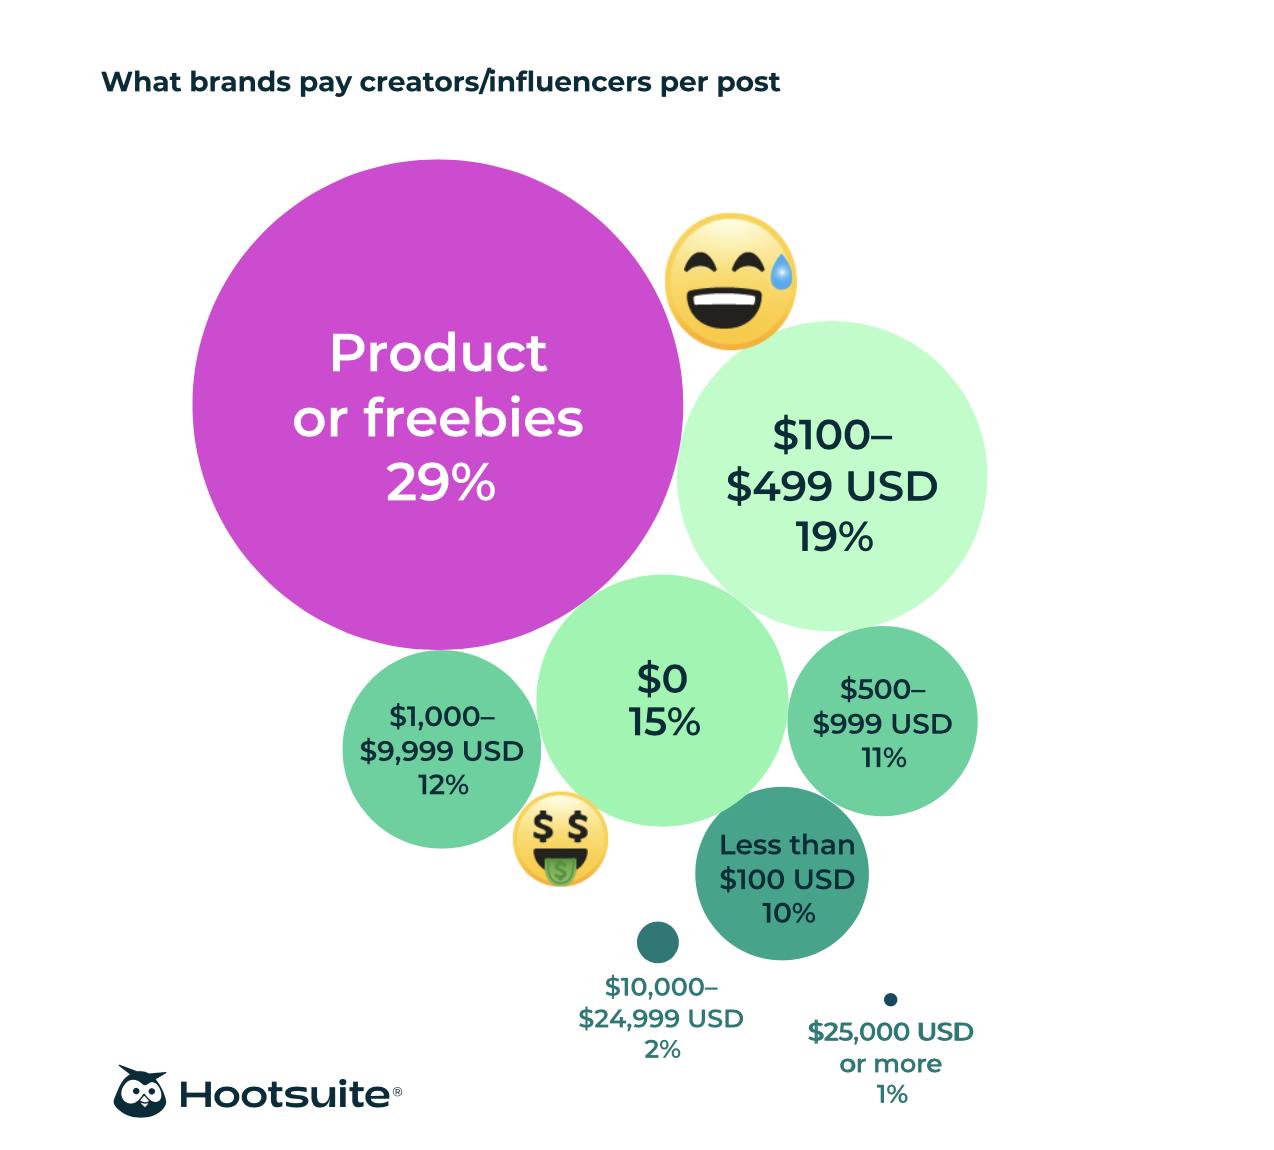
Hiring Instagram influencers is not as expensive as you may think.
- 67% of marketers said they use Instagram for Influencer marketing.
- $2.3 Billion Is Being Spent on Instagram Influencers.
- 55% of brands pay influencers less than $100/post (or offer free products or gifts).
- 19% of brands said they pay influencers between $100-$499/post.
Instagram shopping statistics
- The potential for advertising reach on Instagram is 849.3 million users.
- 44% of Instagram users use shopping features weekly.
- 130 million Instagram users click on Shopping posts every month.
- Video ads get the most engagement, while image ads get just 1 comment per 1000 views.
Instagram user demographics
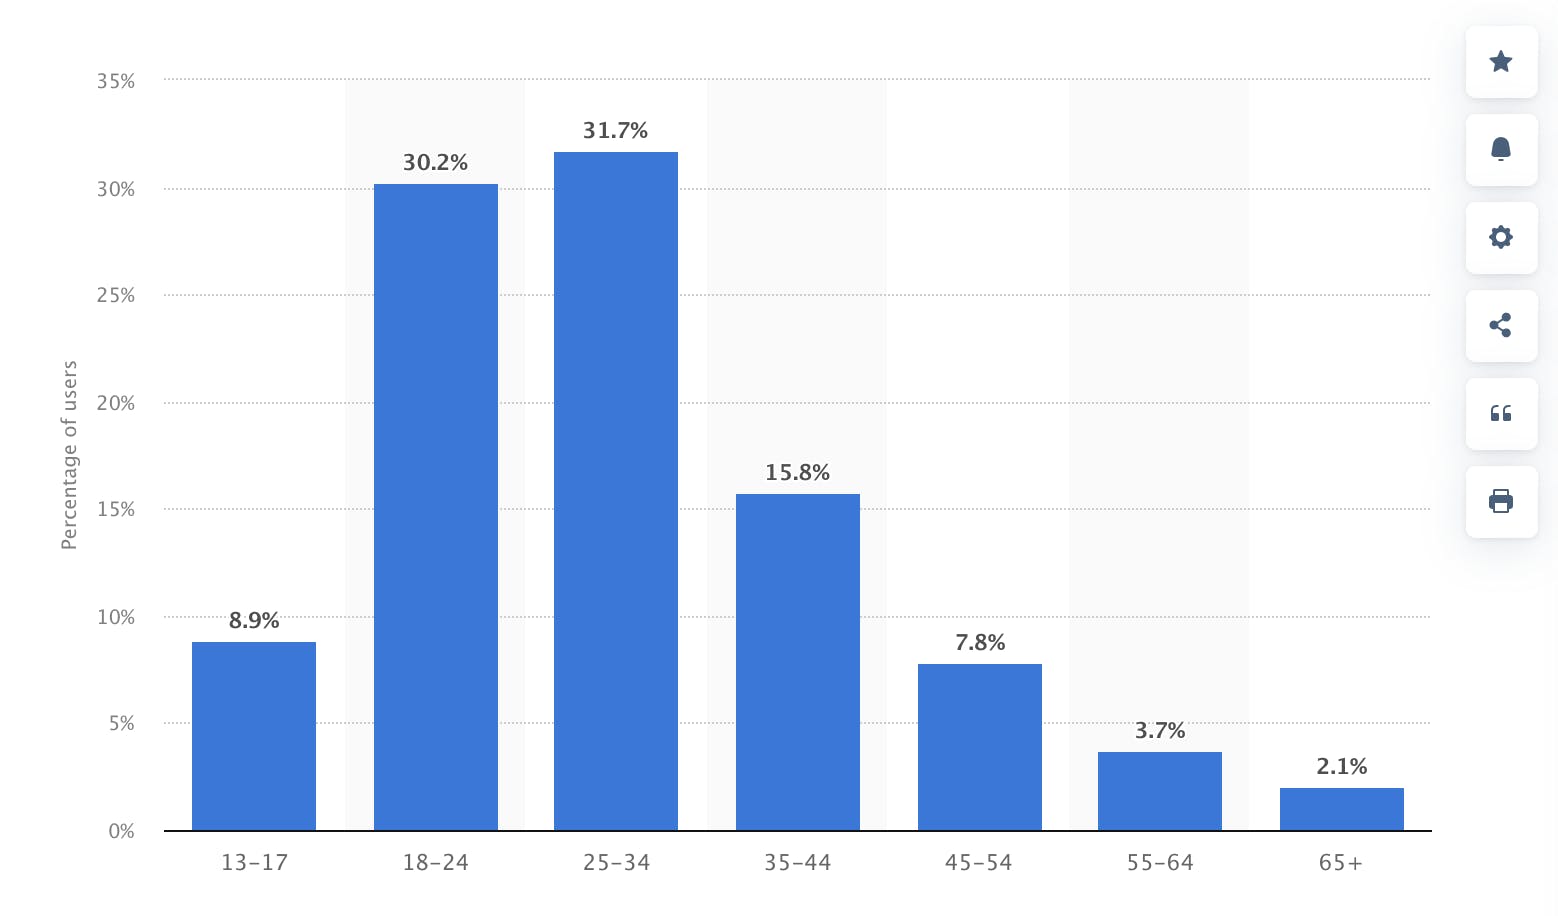
Instagram remains highly popular among teens and younger people.
- Instagram users are almost equally split between genders: 50.3% females and 49.7% males.
- 50.13% of Instagram users are below 34 years old.
- 73% of teenagers in the USA use Instagram.
Instagram video content statistics
In 2022, the most popular content format on Instagram was video.
- In 2022, there was an 80% increase in time spent watching video content on Instagram.
- 82% of marketers posted video content on Instagram.
- 85% of marketers say short-form is the most effective video style they leverage.
- 1 in 4 marketers used Instagram Reels in 2022.
Instagram Story statistics
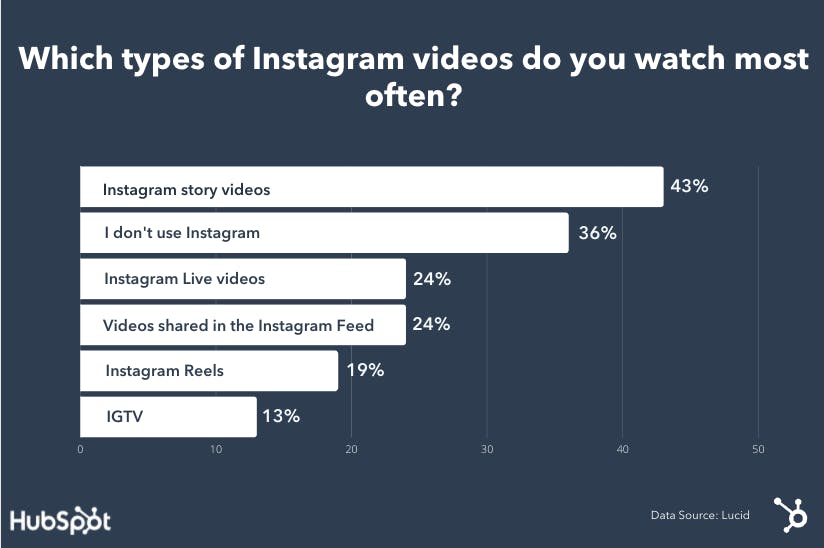
- Stories are more popular than feed posts.
- Stories have the best completion rate (85%).
- 500 million people use Instagram Stories every day.
- 60% of businesses use Stories every week.
Instagram engagement statistics
The average engagement on Instagram is decreasing.
- The average engagement rate for business accounts is 0.83%
- Stories stickers have been found to boost video performance 83% of the time.
- Posts with a location sticker get 79% more engagement.
- Photos with faces get 38% more likes.
Instagram hashtag statistics
- Posts with at least 1 hashtag get 12% more engagement.
Instagram posting statistics
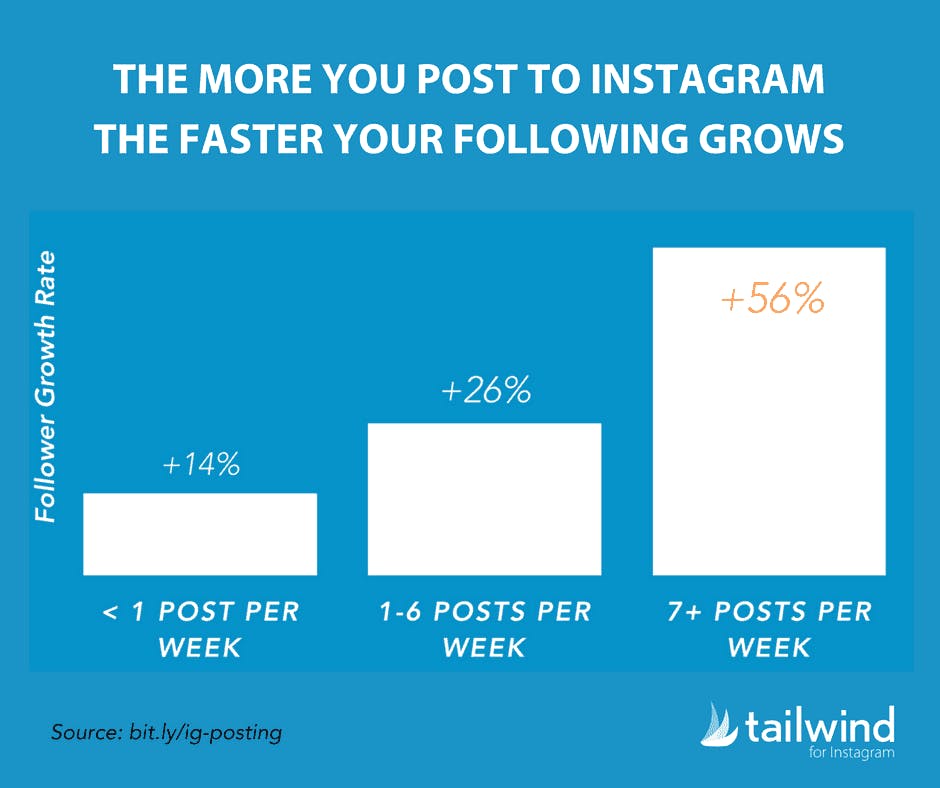
Stats show that the more content you post, the faster you grow your followers on Instagram.
- Brands who shared <1 post/week grew by an average of 14%.
- Brands who shared 7+ posts/week grew by 56%.
- Despite that, only 5% of Instagram accounts share more than 1 post per day.
- Instagram CEO said the best posting frequency is 3-4 feed posts per week, and 1 daily story.
Best time to post on Instagram statistics
Pallyy's analysis of 1.2 million Instagram posts shows that:
- The best time to post on Instagram is 12pm, and the best day is Saturday.
- The best time to post Reels is 2pm, on Saturdays.
Read our full guide about the best times to post on Instagram.
Top industries using Instagram
These are the top 5 industries on Instagram:
- Fashion: 50% of Instagram users follow and engage with fashion brands.
- F&B: Food industry has the highest engagement rate on Instagram (7.38%).
- Travel: 40% of Instagram users under the age of 30 have booked a trip after finding out about it on Instagram.
- Real estate: 44% of real estate agents got a new client through social media.
- Beauty: Beauty brands and influencers account for almost 90% of content published on Instagram.
Fun Instagram statistics and facts
- The most popular hashtags in 2022 are #love, #instagood, #fashion and #beautiful.
- The most followed person on Instagram is Christiano Ronaldo with 506 million followers in 2022.
- The most followed brand on Instagram is Nike with 252 million followers in 2022.
- The country with the most number of Instagram users and growth in 2022 is India.
- The first photo ever posted on Instagram was a dog.
- You can send up to 50-100 DMs a day before getting flagged as spammer.
The origins of Instagram
- Instagram was founded in 2010 by Kevin Systrom and Mike Krieger.
- It was originally a photo-sharing app used mainly by photographers.
- Instagram's original name was Codename, but it was changed before launch.
- Originally Facebook bought Instagram for $1 billion.
Related Articles
